

Introduction
Superstore sales dashboard is a sales and profit analysis dashboard developed by me using US Superstore dataset for analyzing the sales and profits of US superstore from the year 2014 to 2017 in the Power BI.
In this article, I will share with you what is the need for this project, how you should approach developing a Power BI report, the key Power BI visuals used for the project development, and why I choose Power BI for developing a superstore sales dashboard.
What is the need for the project?
I have seen a lot of people struggling with getting meaningful insights from a large number of excel sheets. Data related to shipping, location, products, customers, product quantity, discounts, etc. are mostly stored in Excel sheets for a local superstore, small-scale inventories, etc. This data may vary from thousands to millions of details inside a single Excel.
So, it is quite difficult to identify data key patterns by directly looking into the excel data. That's when we can import excel data into Power BI for data analysis purposes. In this way, we can get the key data patterns, apply filters to data, and categorize data based on locations, product categories, analyze sales and profit-related details and gain many other insights based on our requirements.
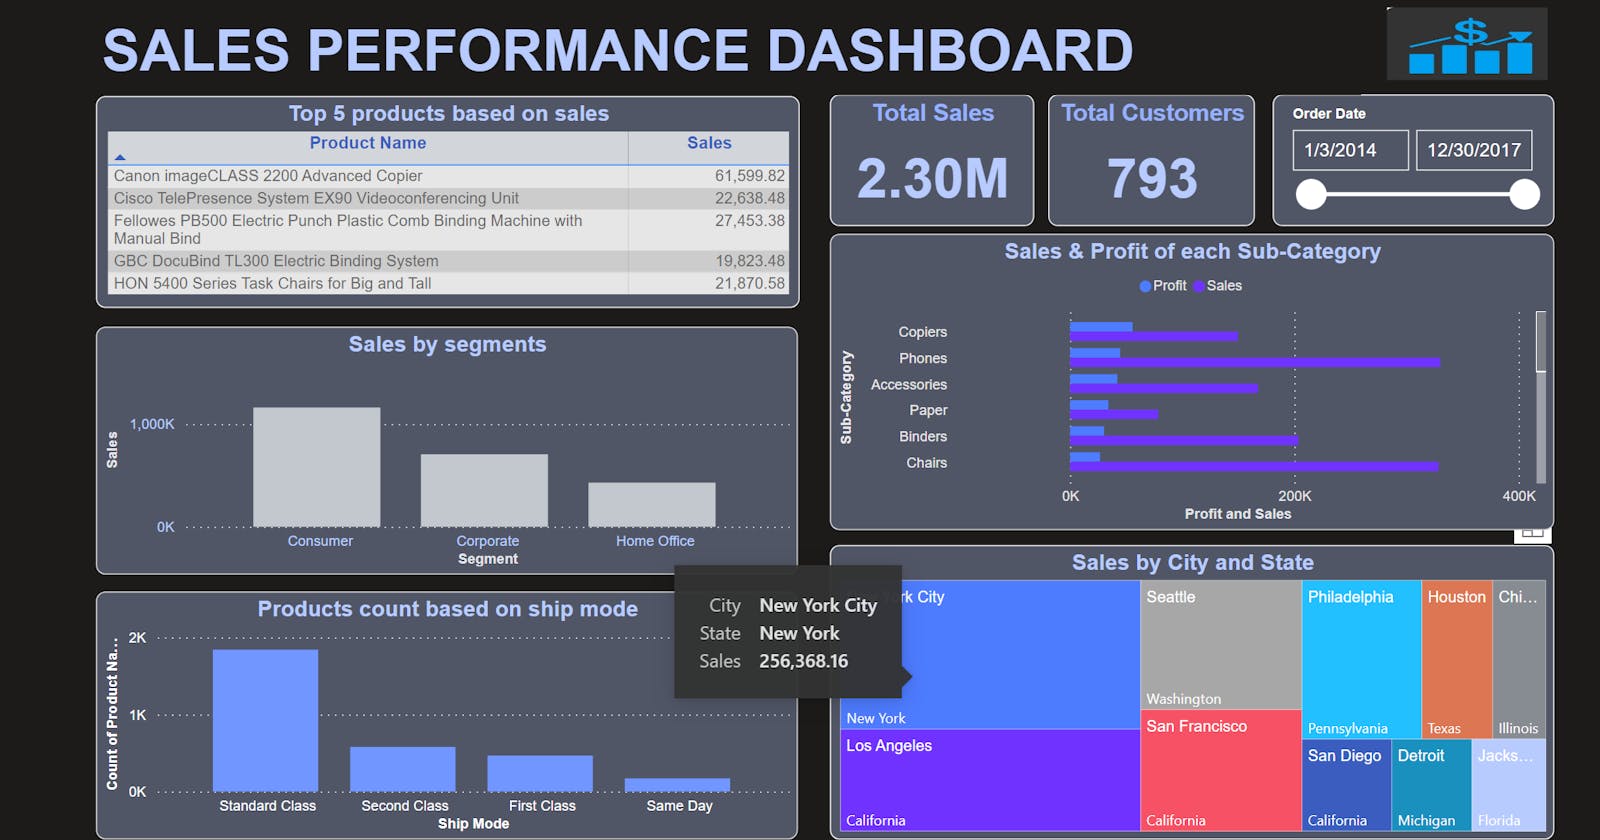
In this project, I am taking the data of US superstores and using Power BI reports showing the sales & profits based on product sub-categories, products having a large number of sales, classifying sales numbers based on city and state, profits based on region and segments, etc.
Approach for developing a Power BI report using Power BI Desktop
You can follow the below steps for developing a Power BI report using Power BI Desktop:
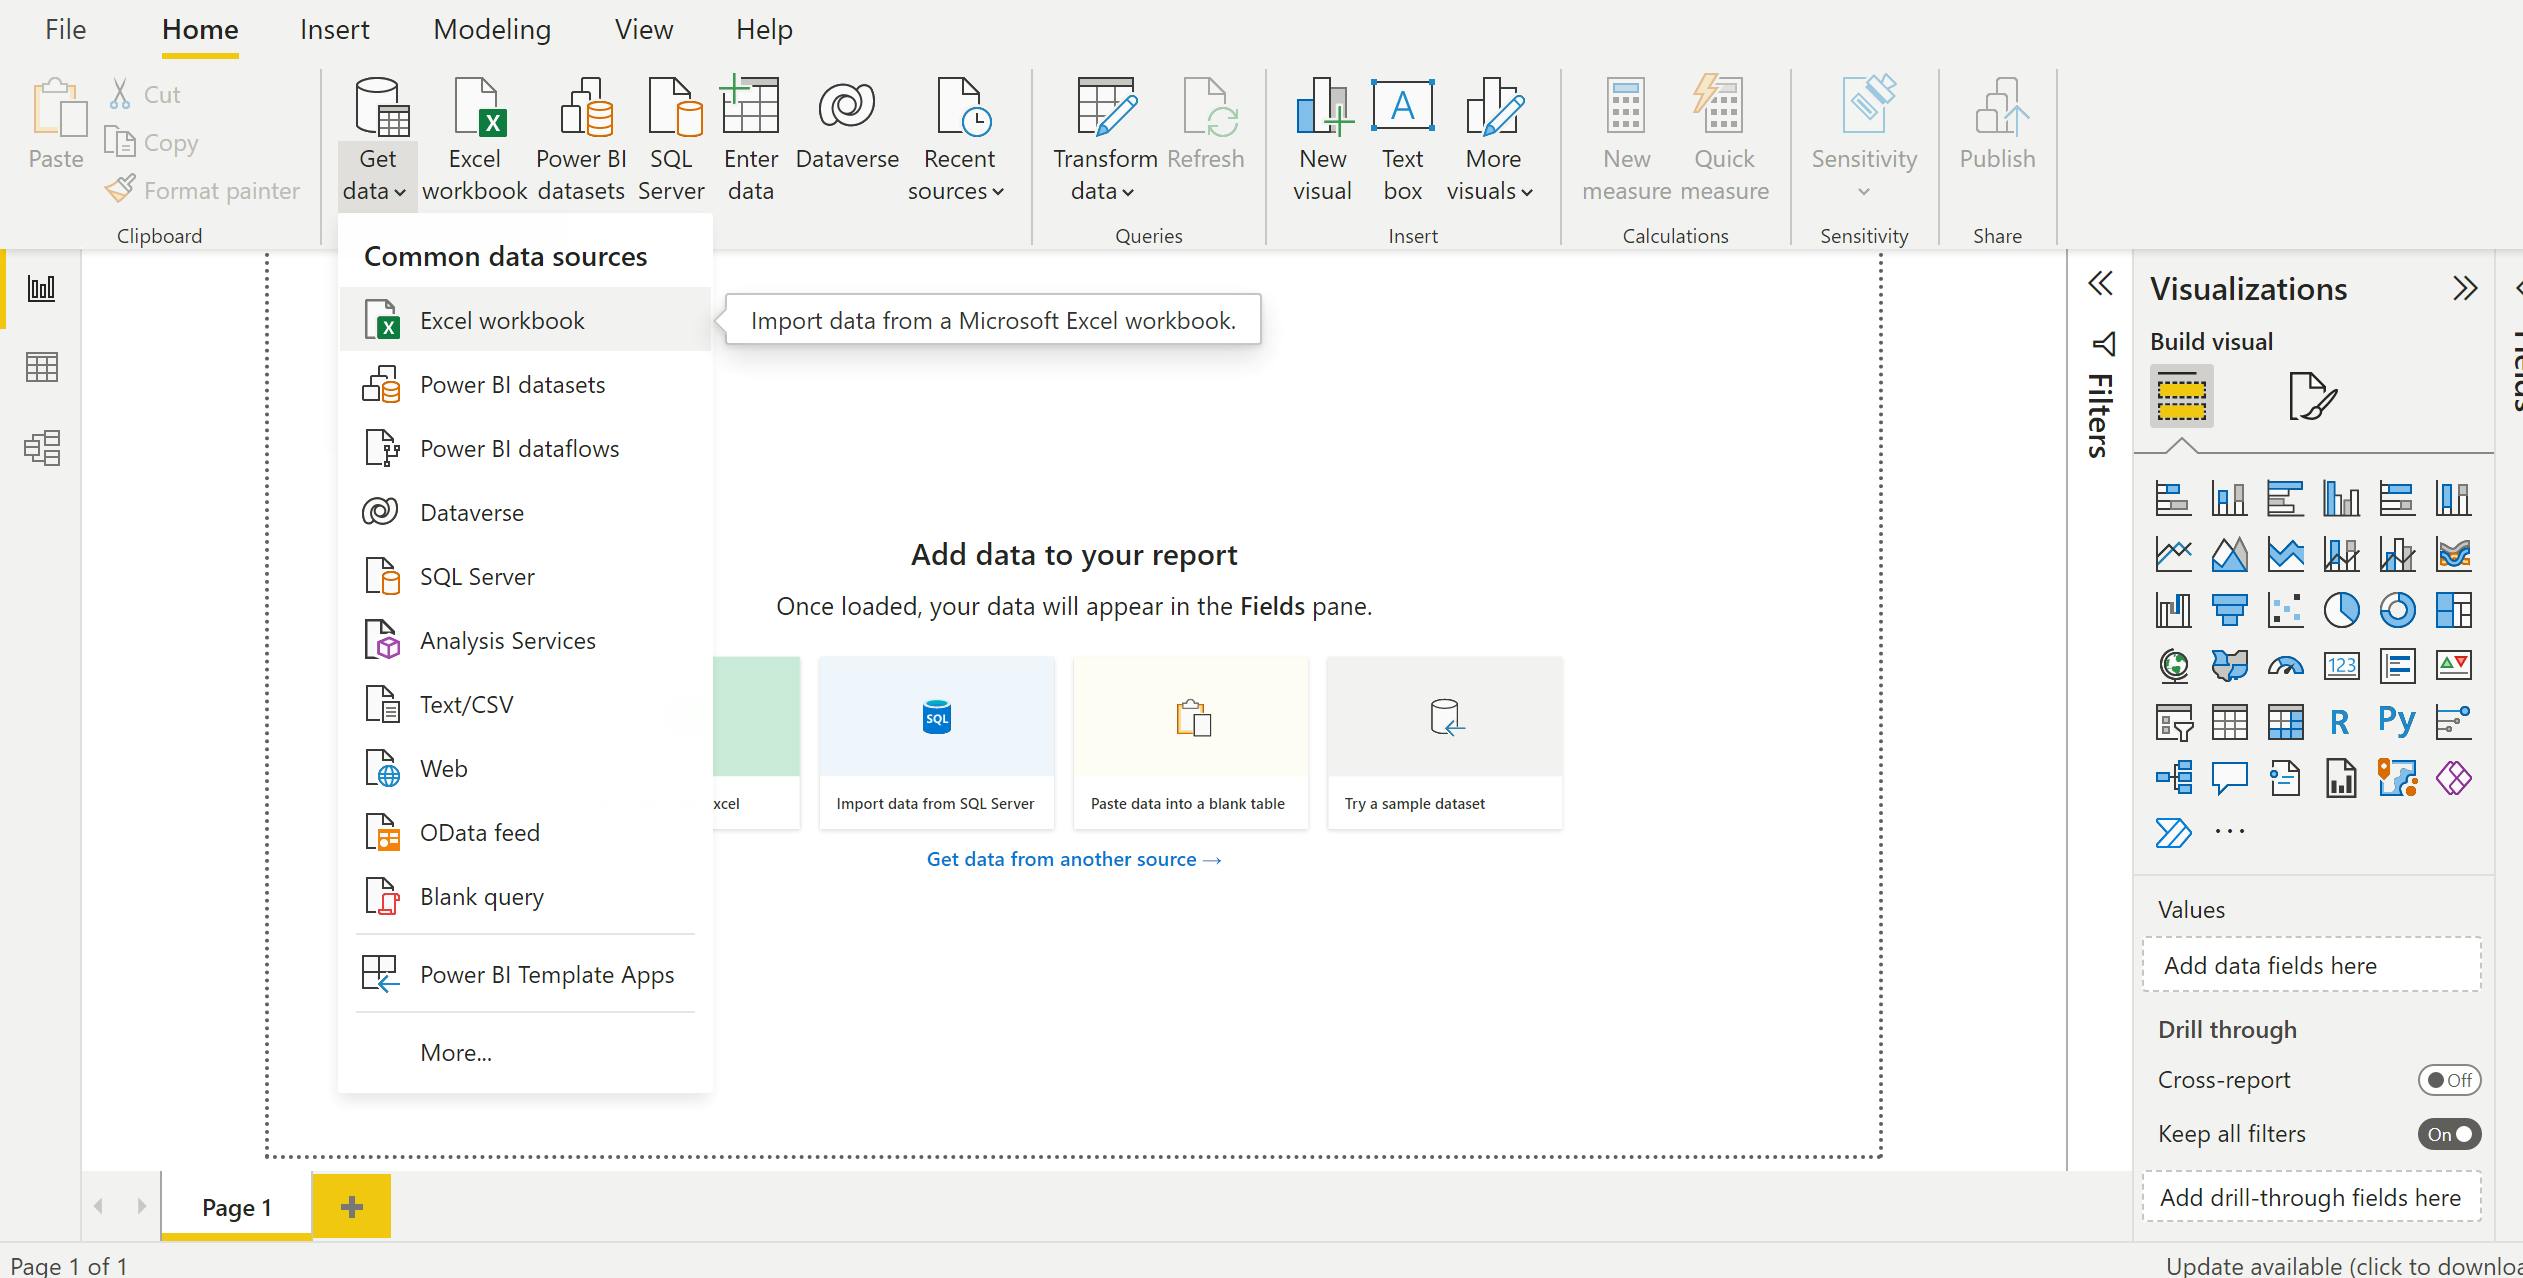
1.Import Data: For developing the report, you first need to import data. Data can be imported from various sources like excel, web, Azure SQL, SQL server, Sharepoint lists, etc. in Power BI.
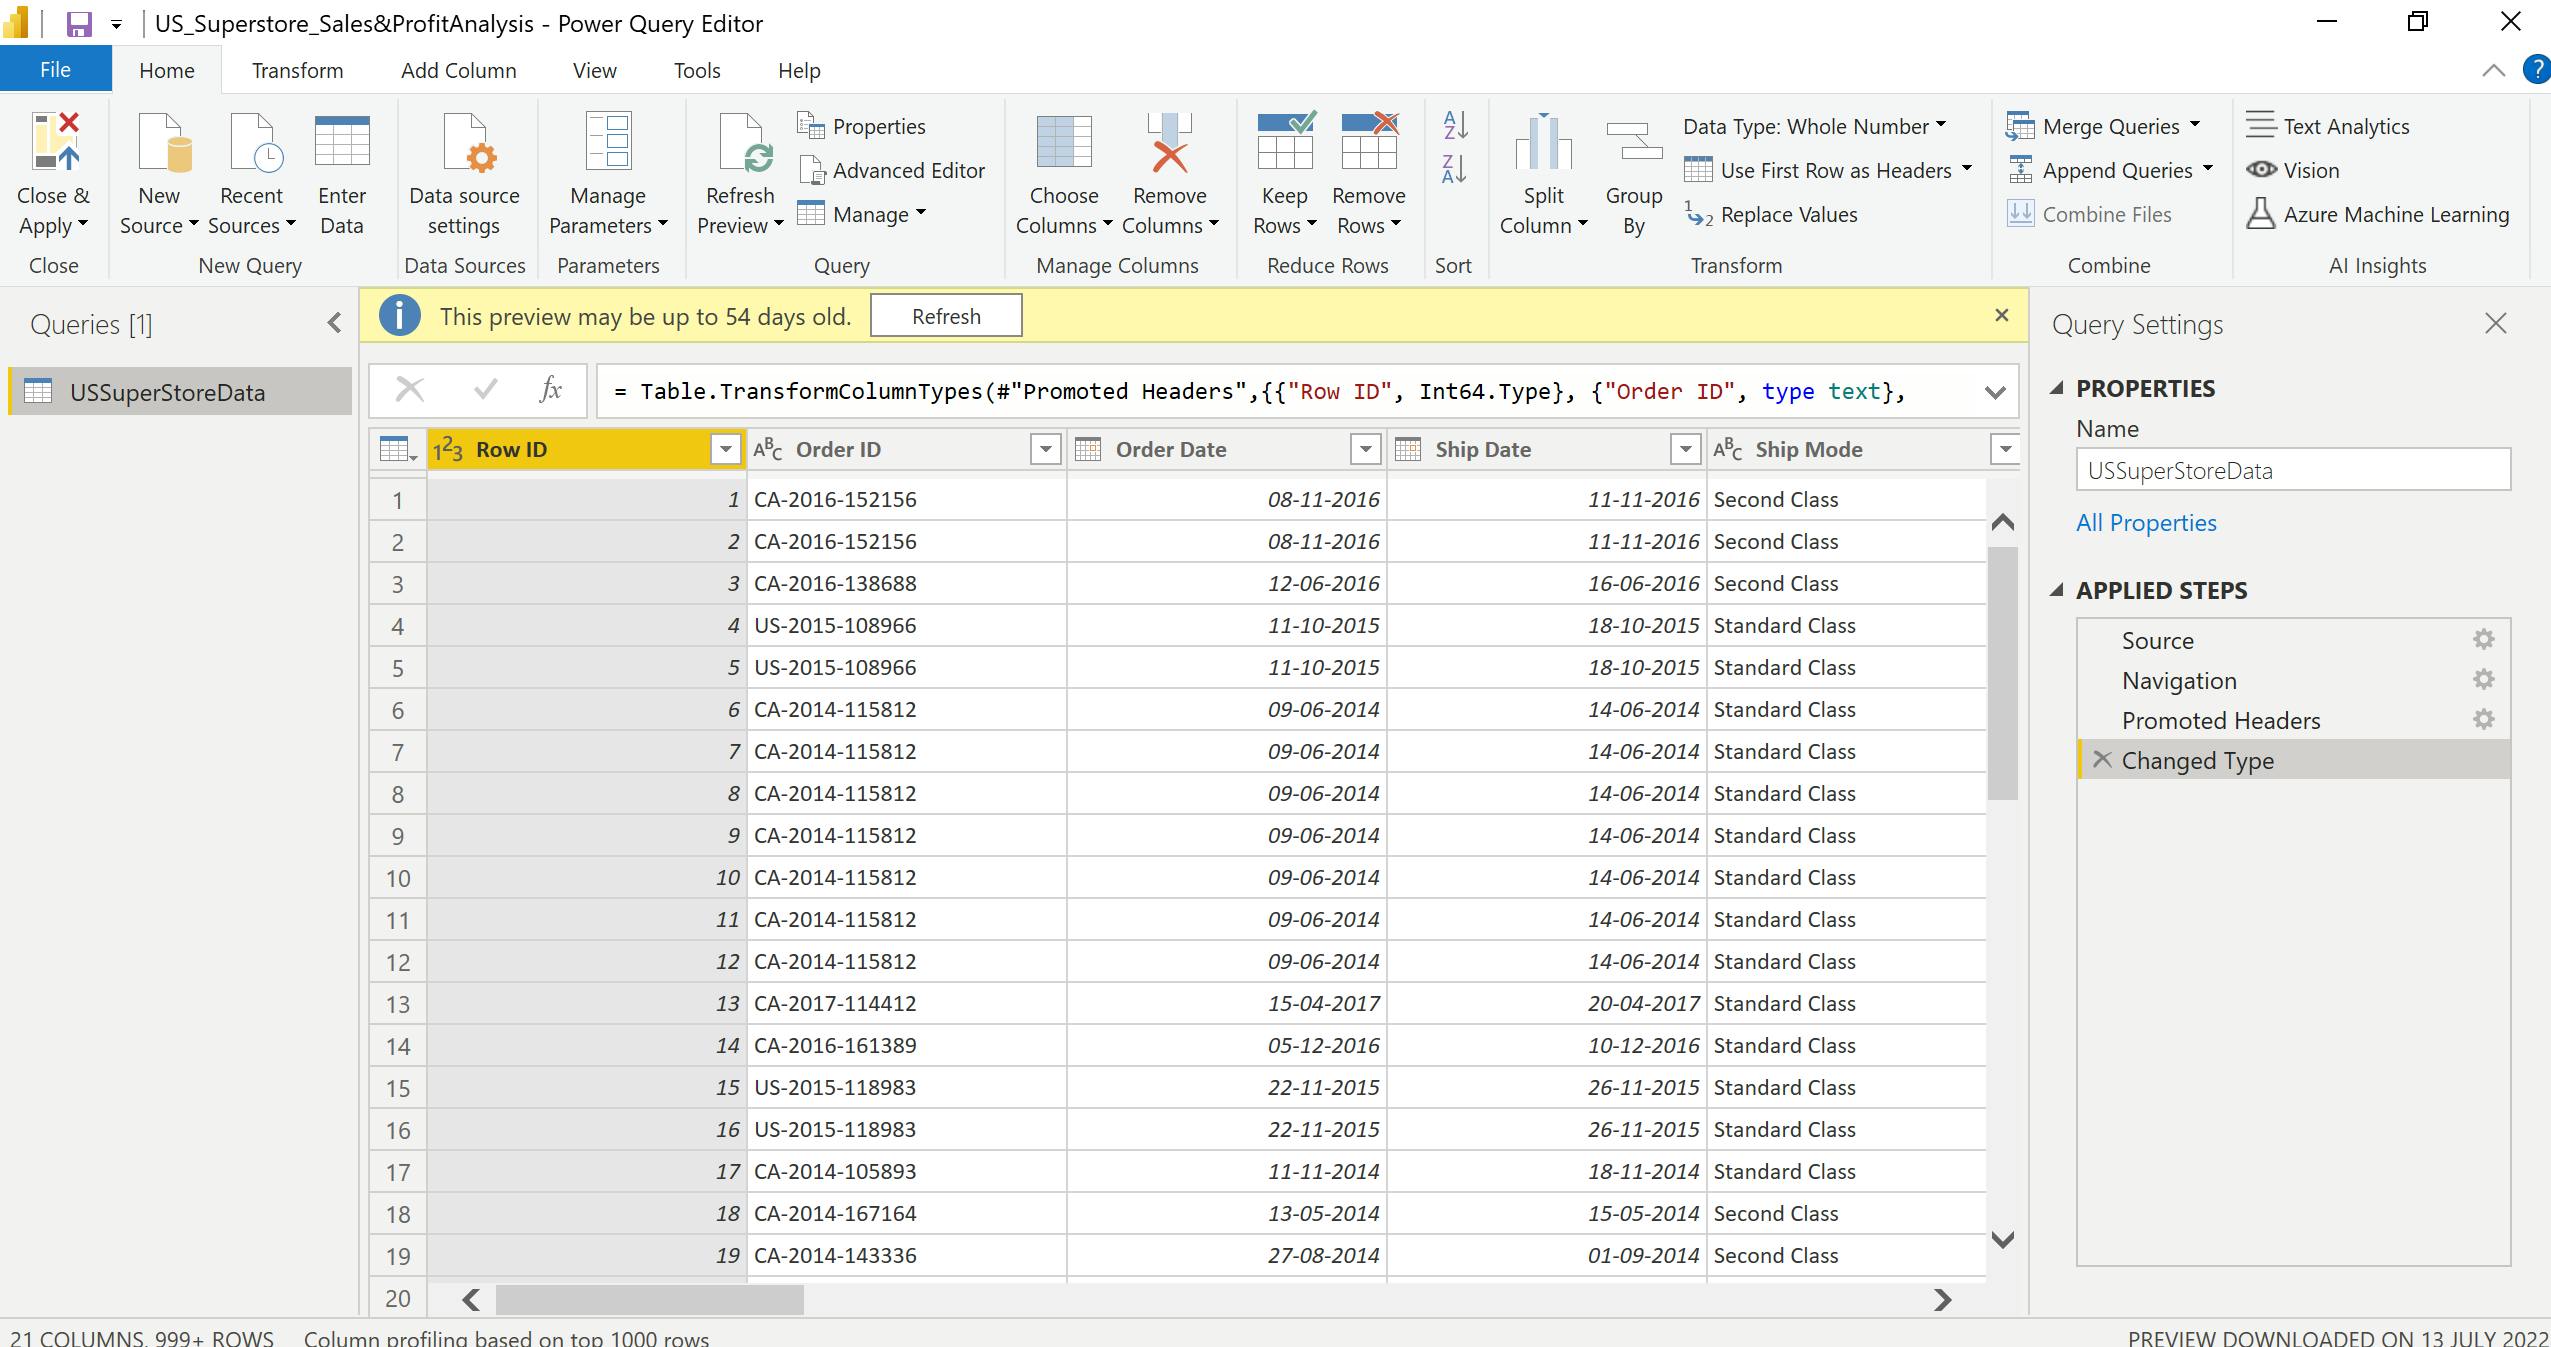
2.Transforming and shaping data according to your requirements: After data gets imported successfully, using the Power Query we can transform and shape the data. We can perform data steps like removing duplicate data, changing the data type of a column, drilling down, merging tables data and column renaming, etc. in this step.
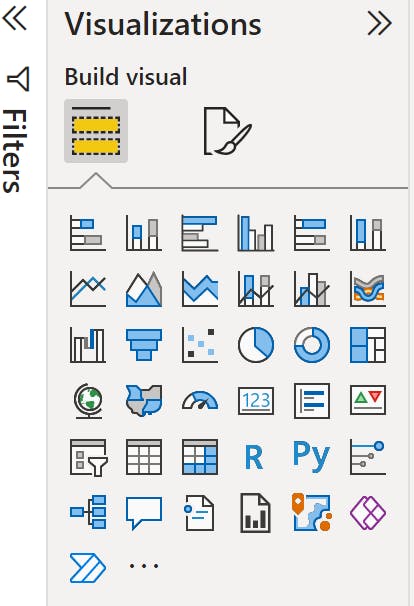
3.Building Reports: After performing and saving data transformations, move to the reports tab to create reports. From the visuals, select the visuals such as a stacked column chart, area chart, table, matrix, card, clustered bar chart, etc. or custom visuals according to your needs to create a report.
4.Publish Report: Once the report is completed, click on Publish to publish the report inside a workspace in Power BI Service.
Key Power BI visuals used for developing this project
I have used the below visuals:
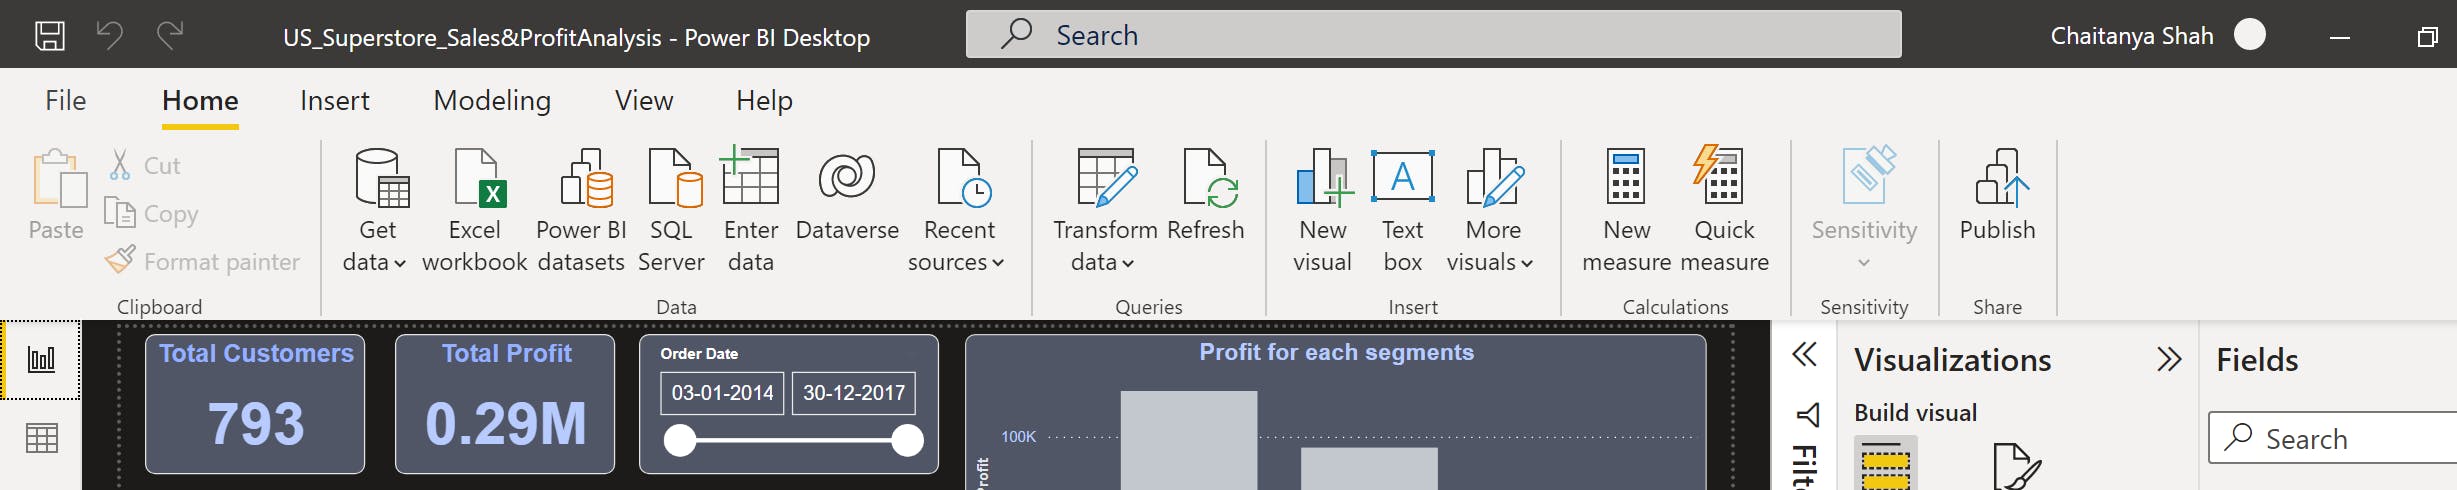
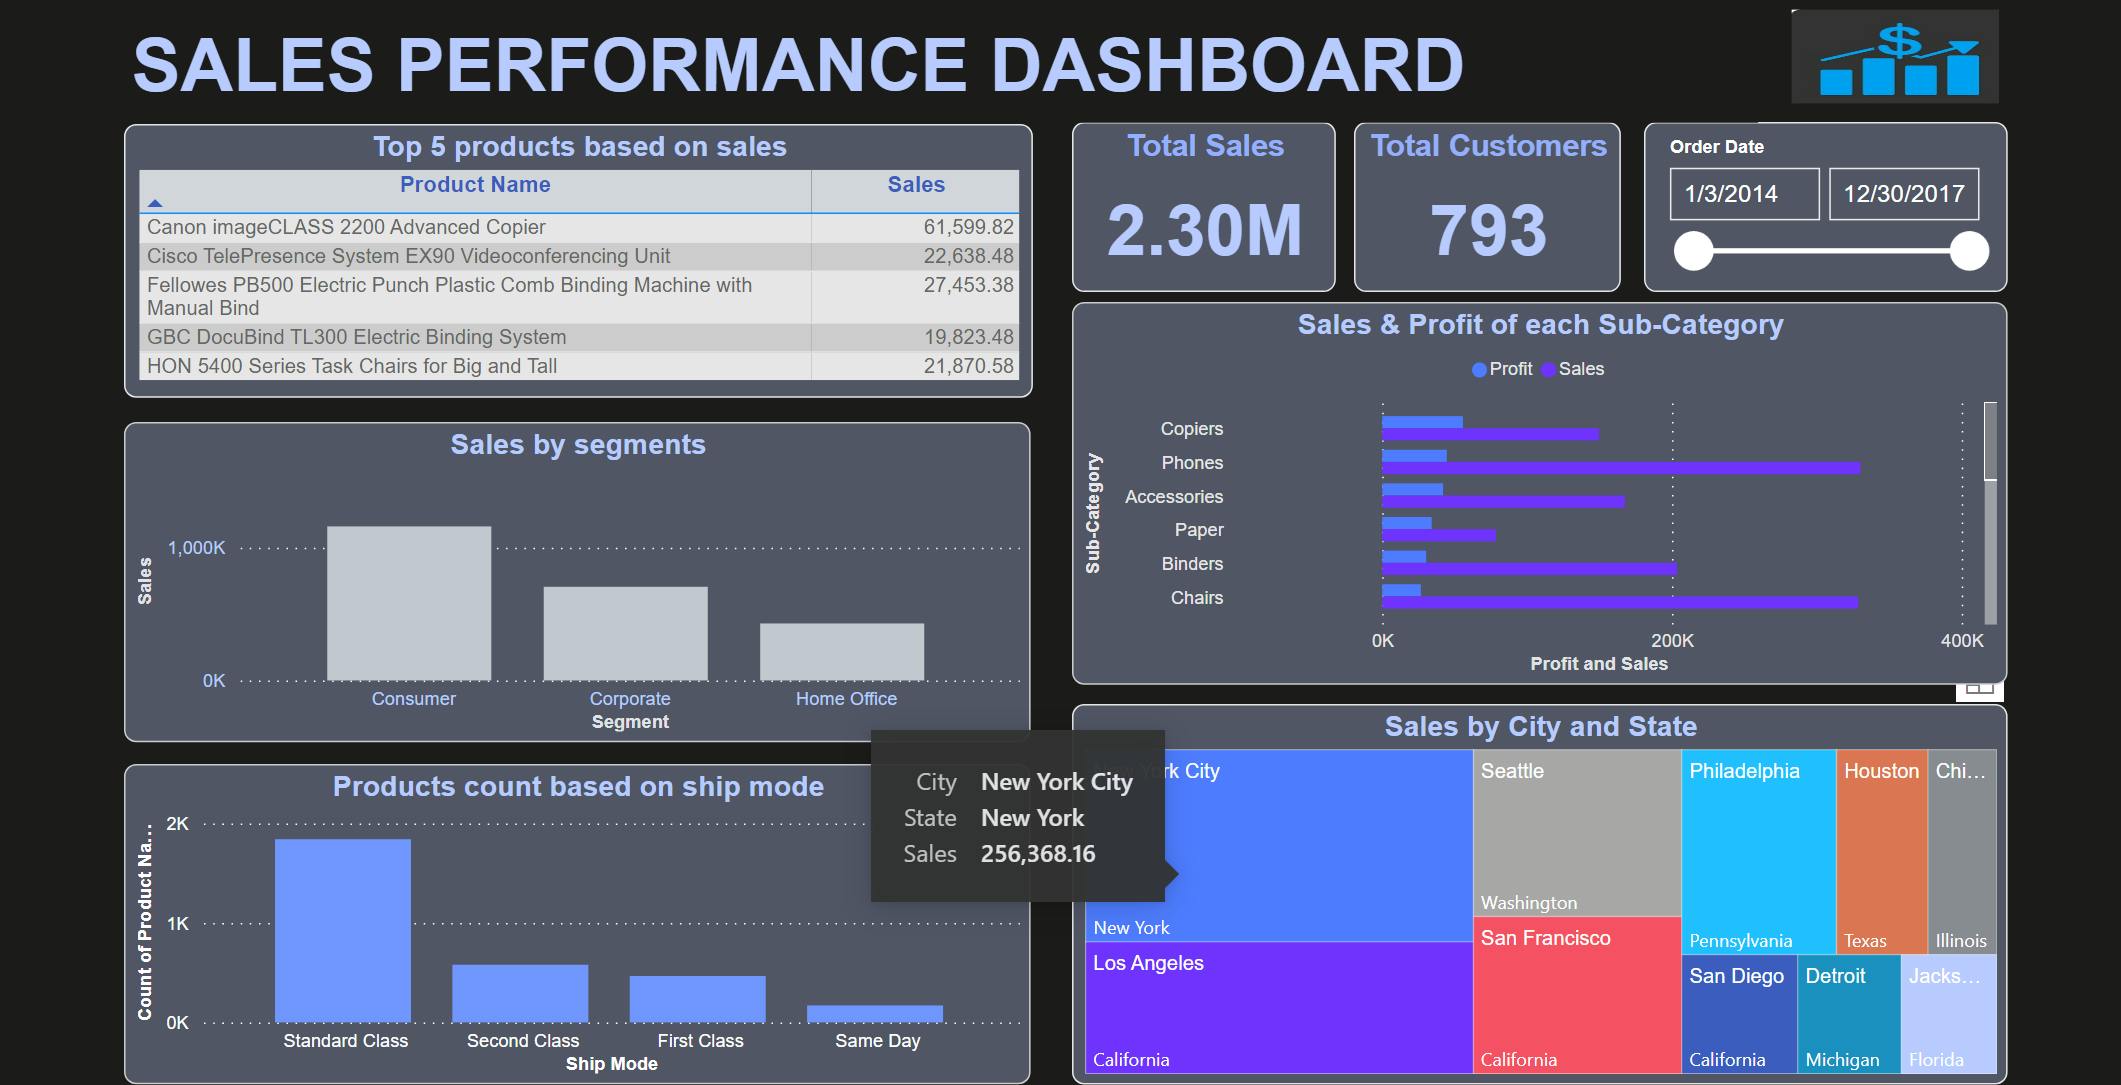
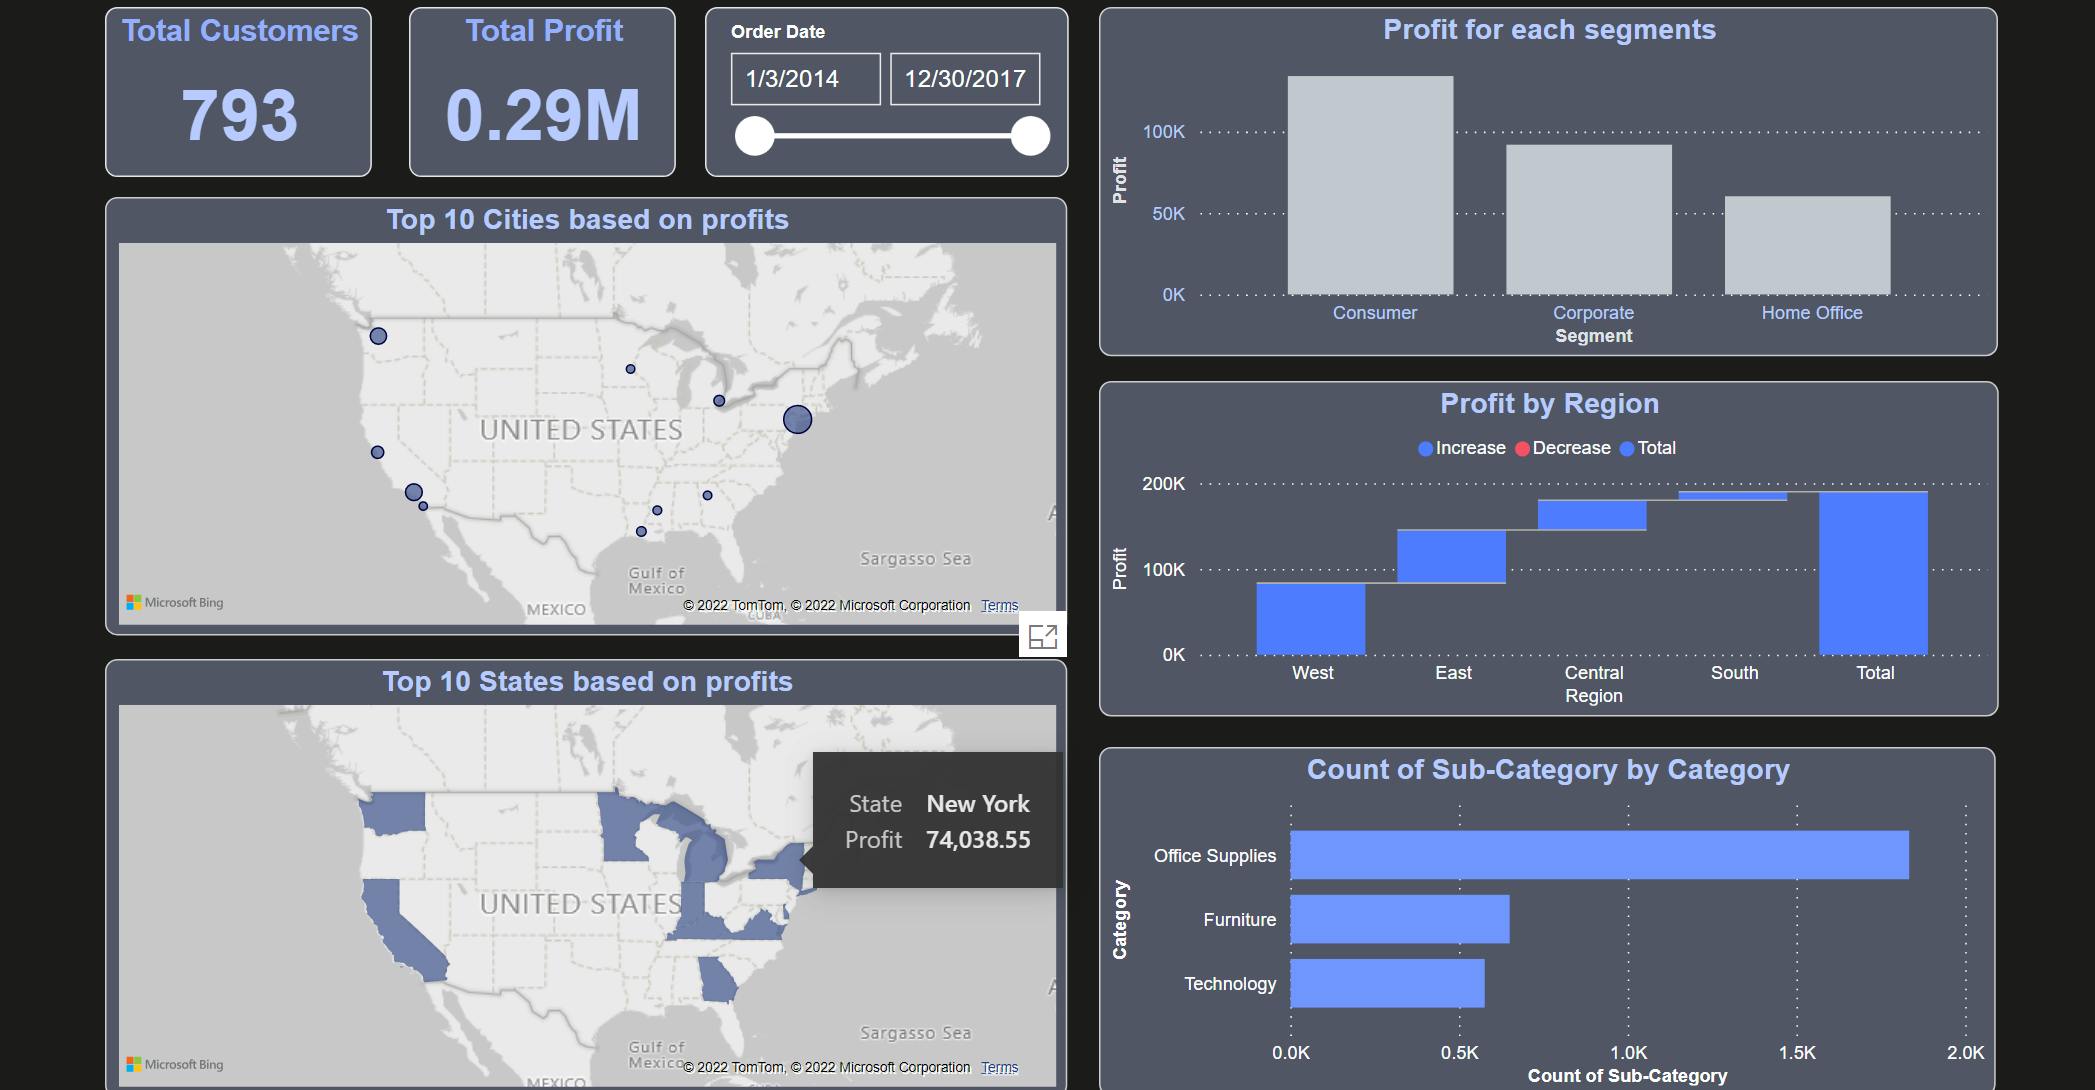
Cards: For showing total customers, sales and profits.
Stacked column chart: For showing profits based on segments, sales by segments and product count based on ship mode.
Clustered bar chart: For showing sales and profits based on product sub-categories.
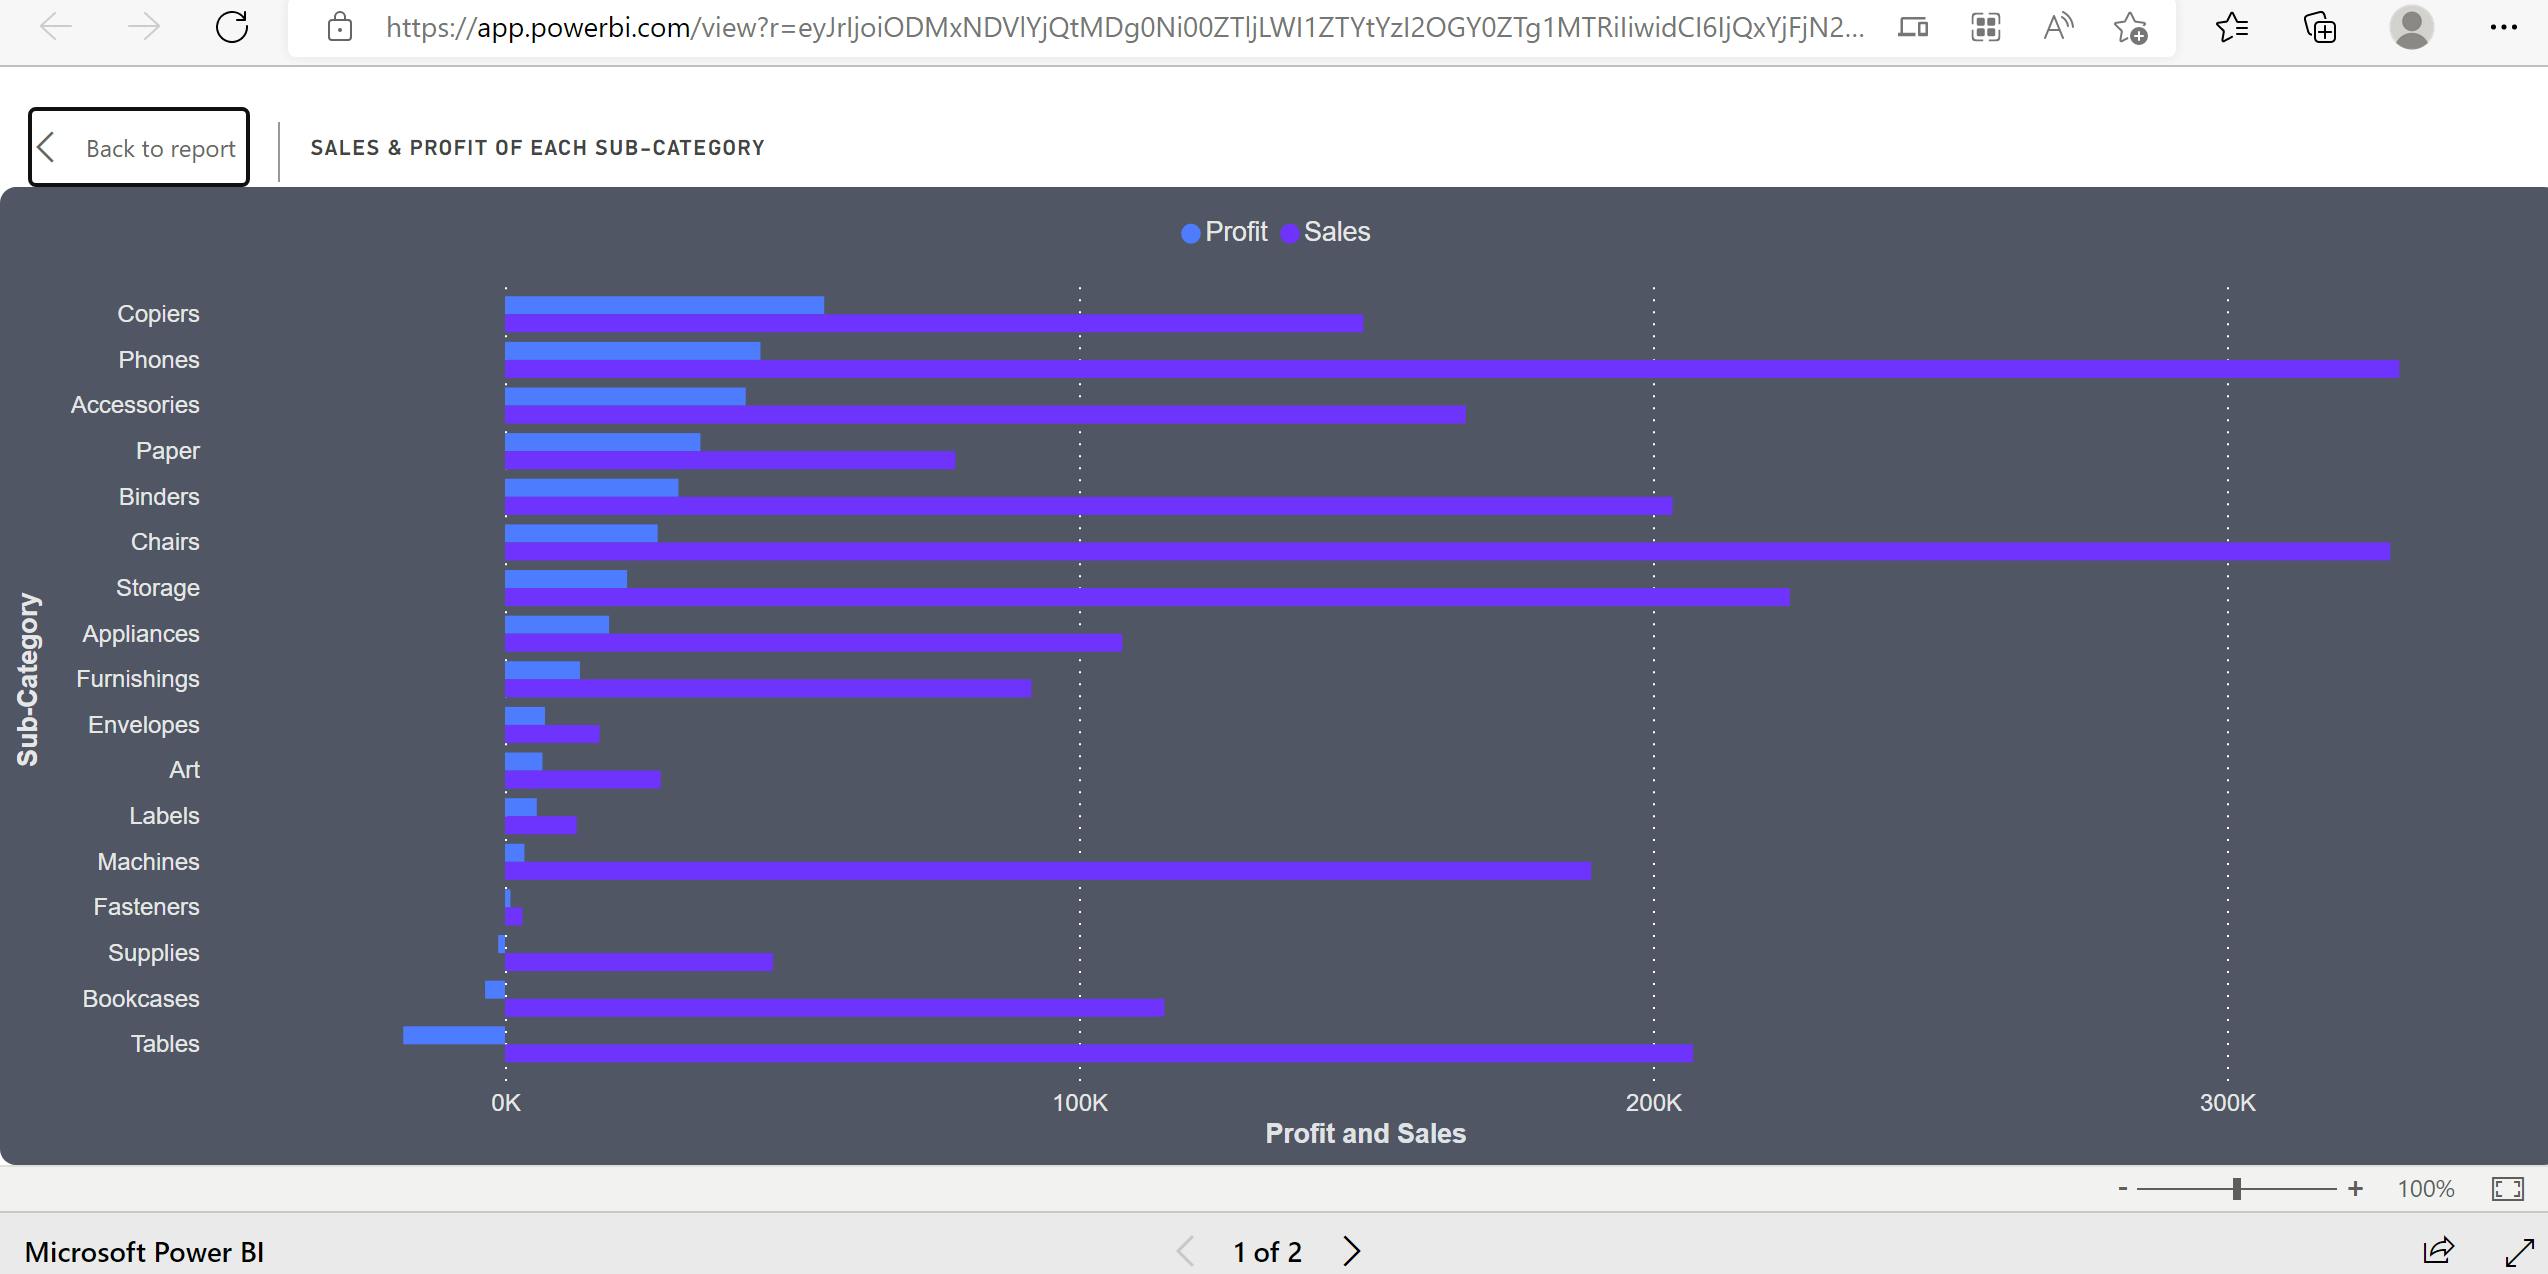
Table: For showing the top 5 products having the highest number of sales.
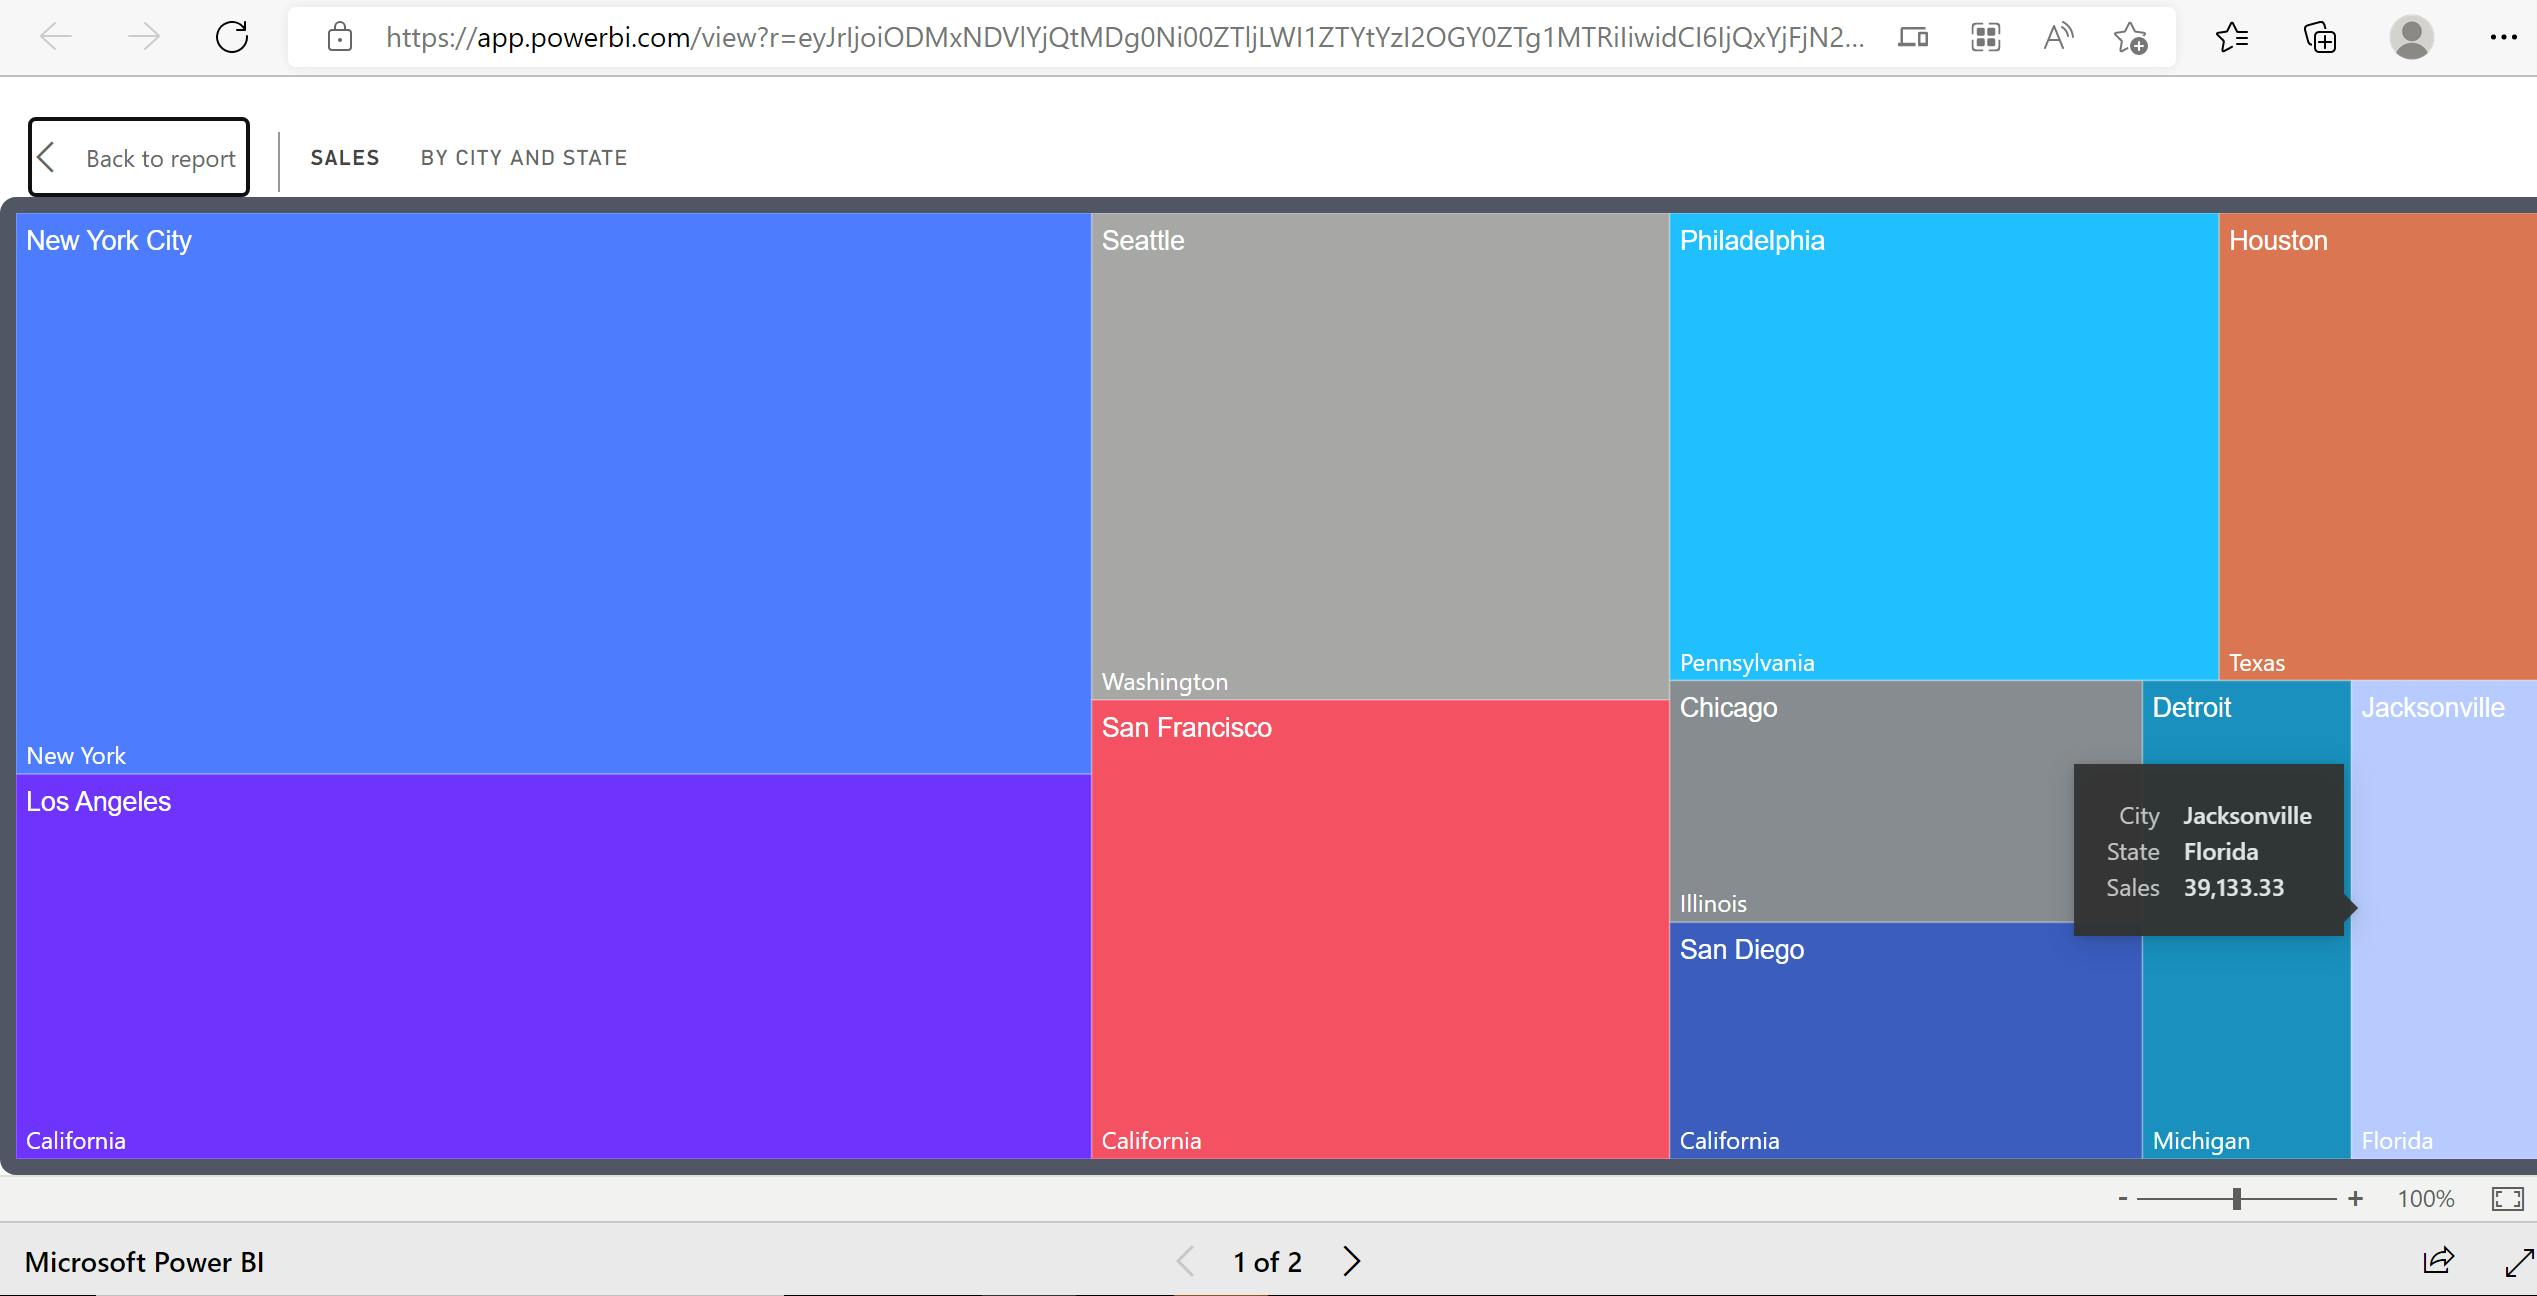
Treemap: For showing sales based on city and states.
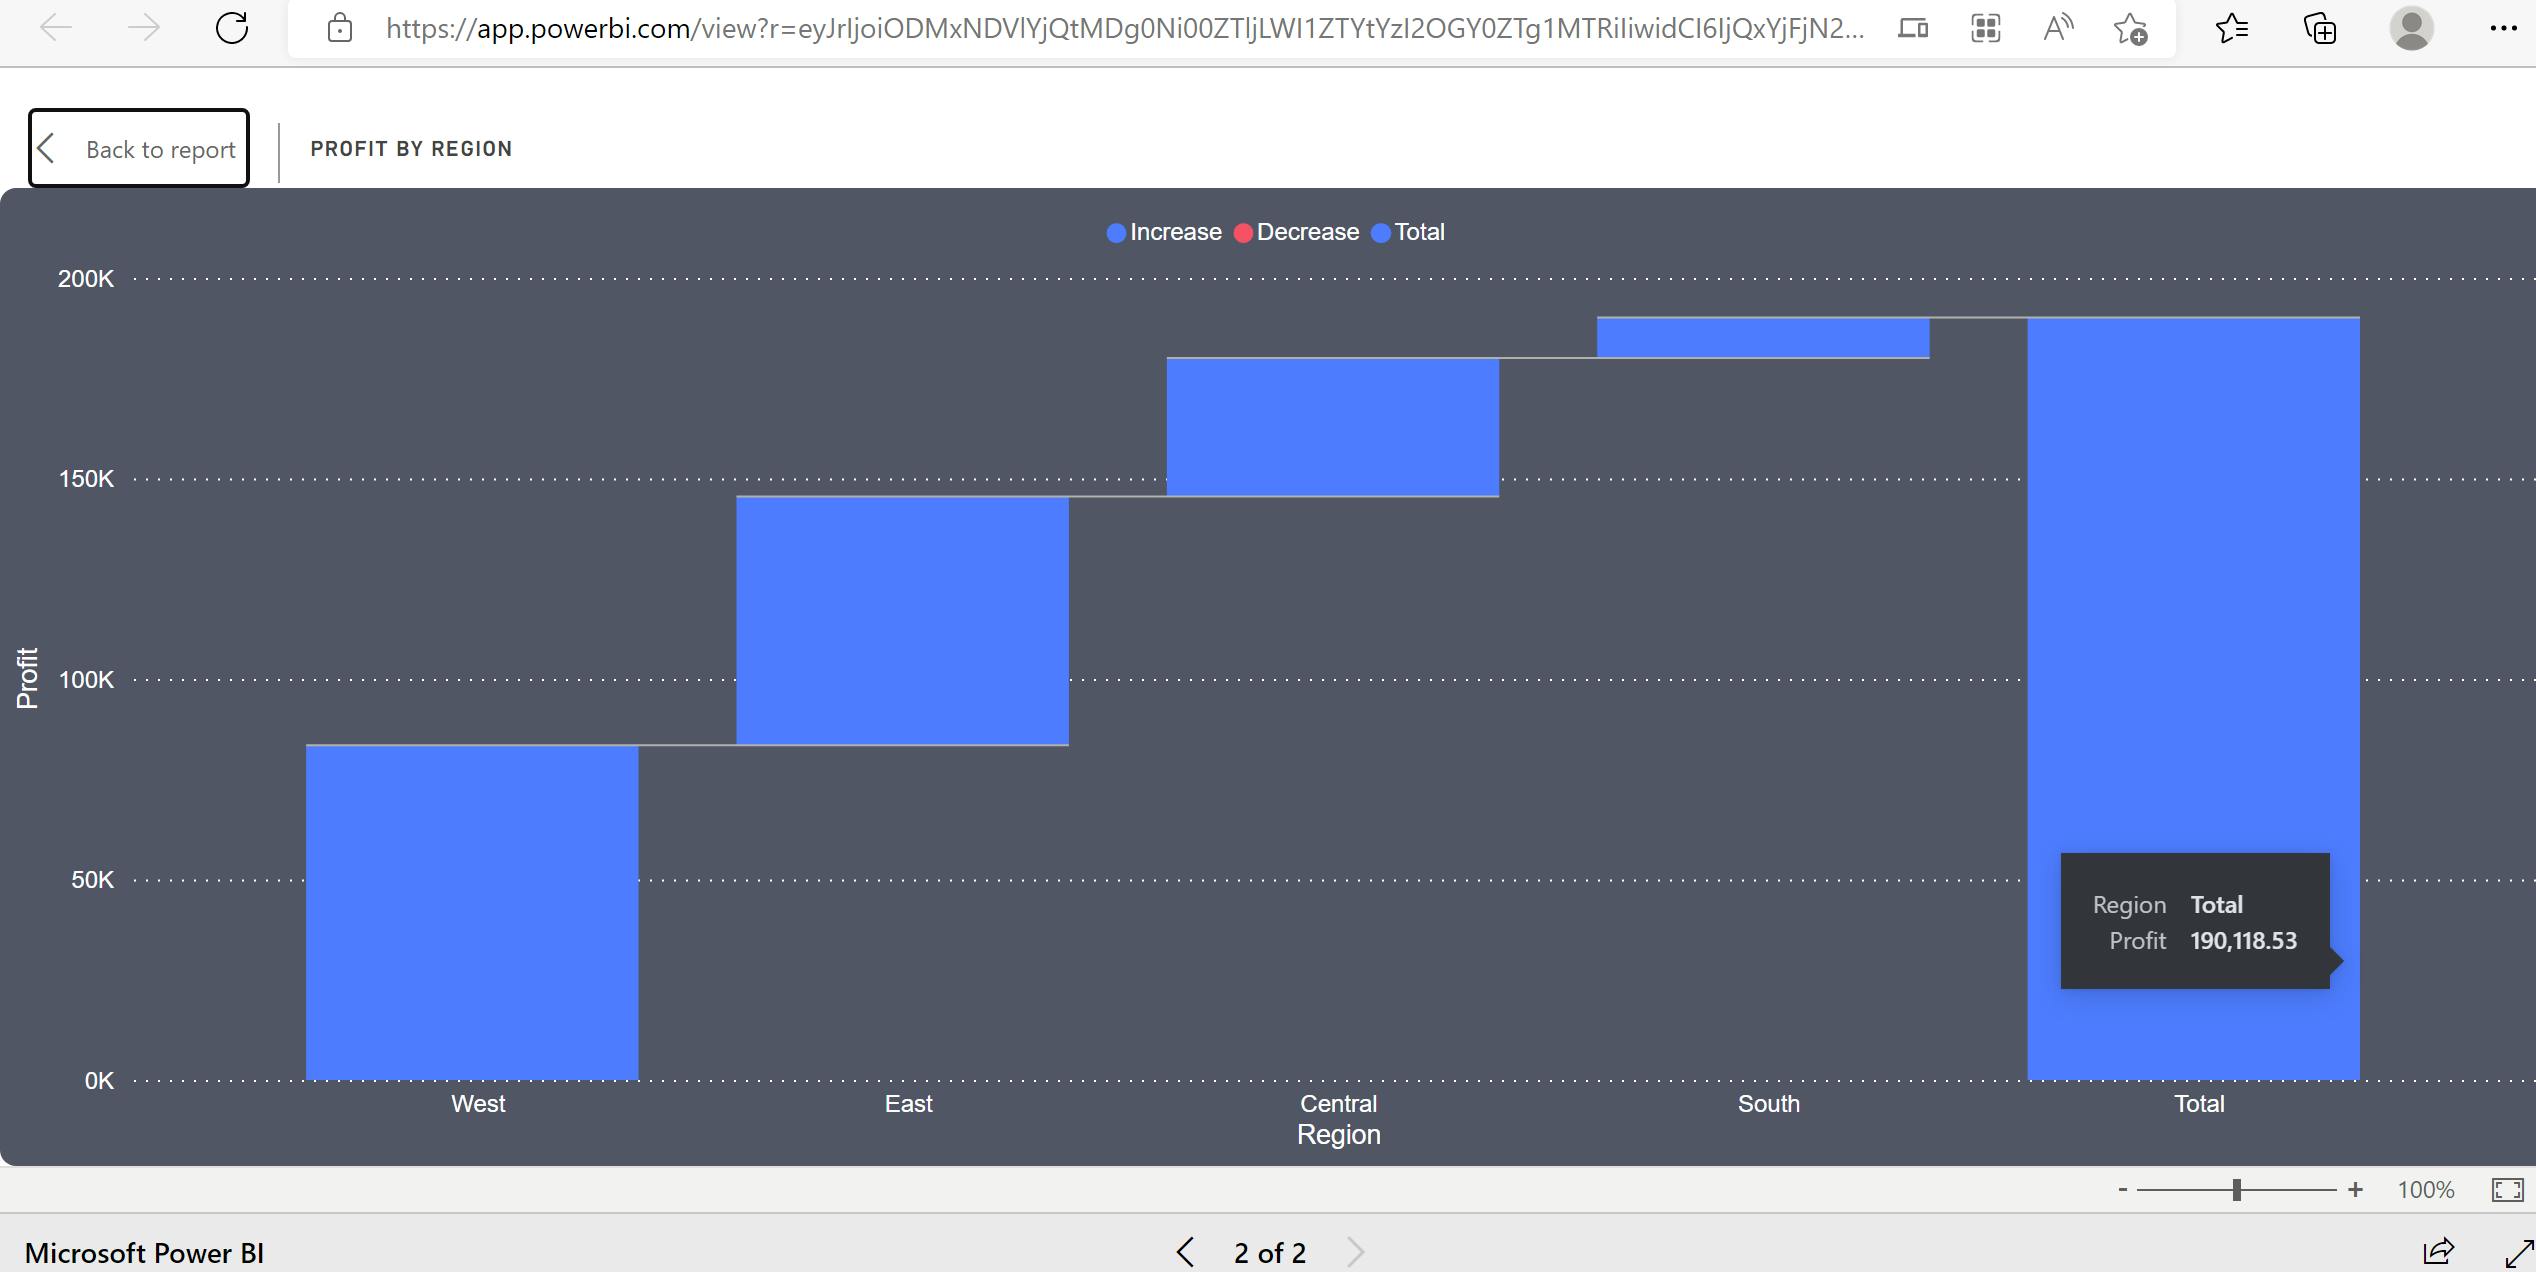
Waterfall chart: For showing profits by region.
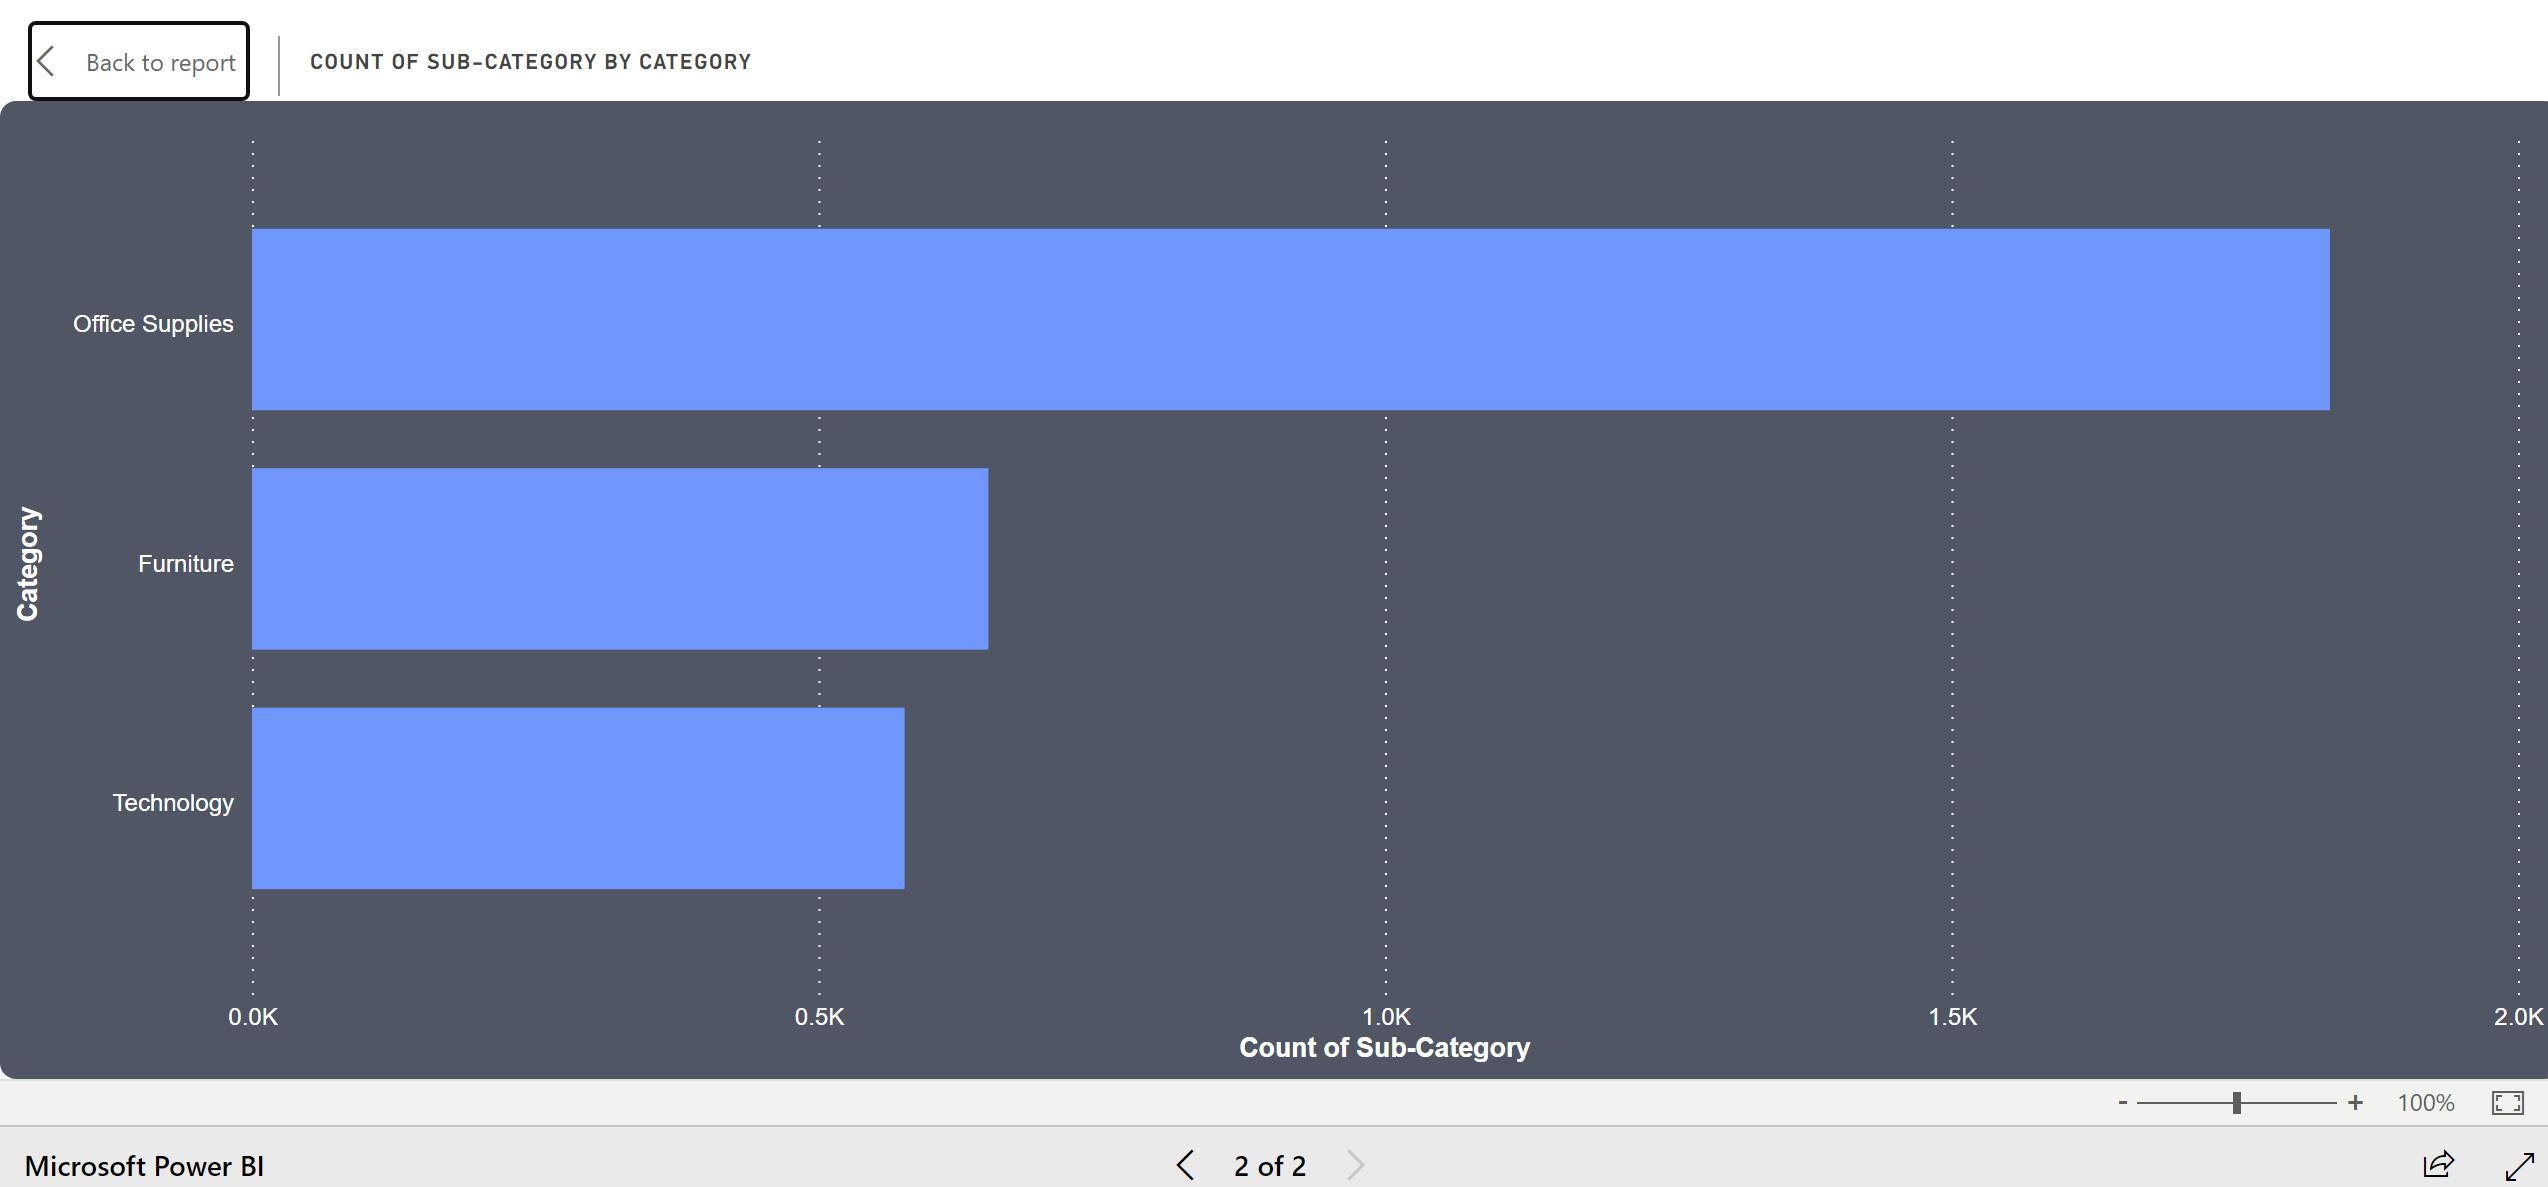
Stacked bar chart: For showing sub-categories present inside a category.
Slicer: For filtering data based on the order date.
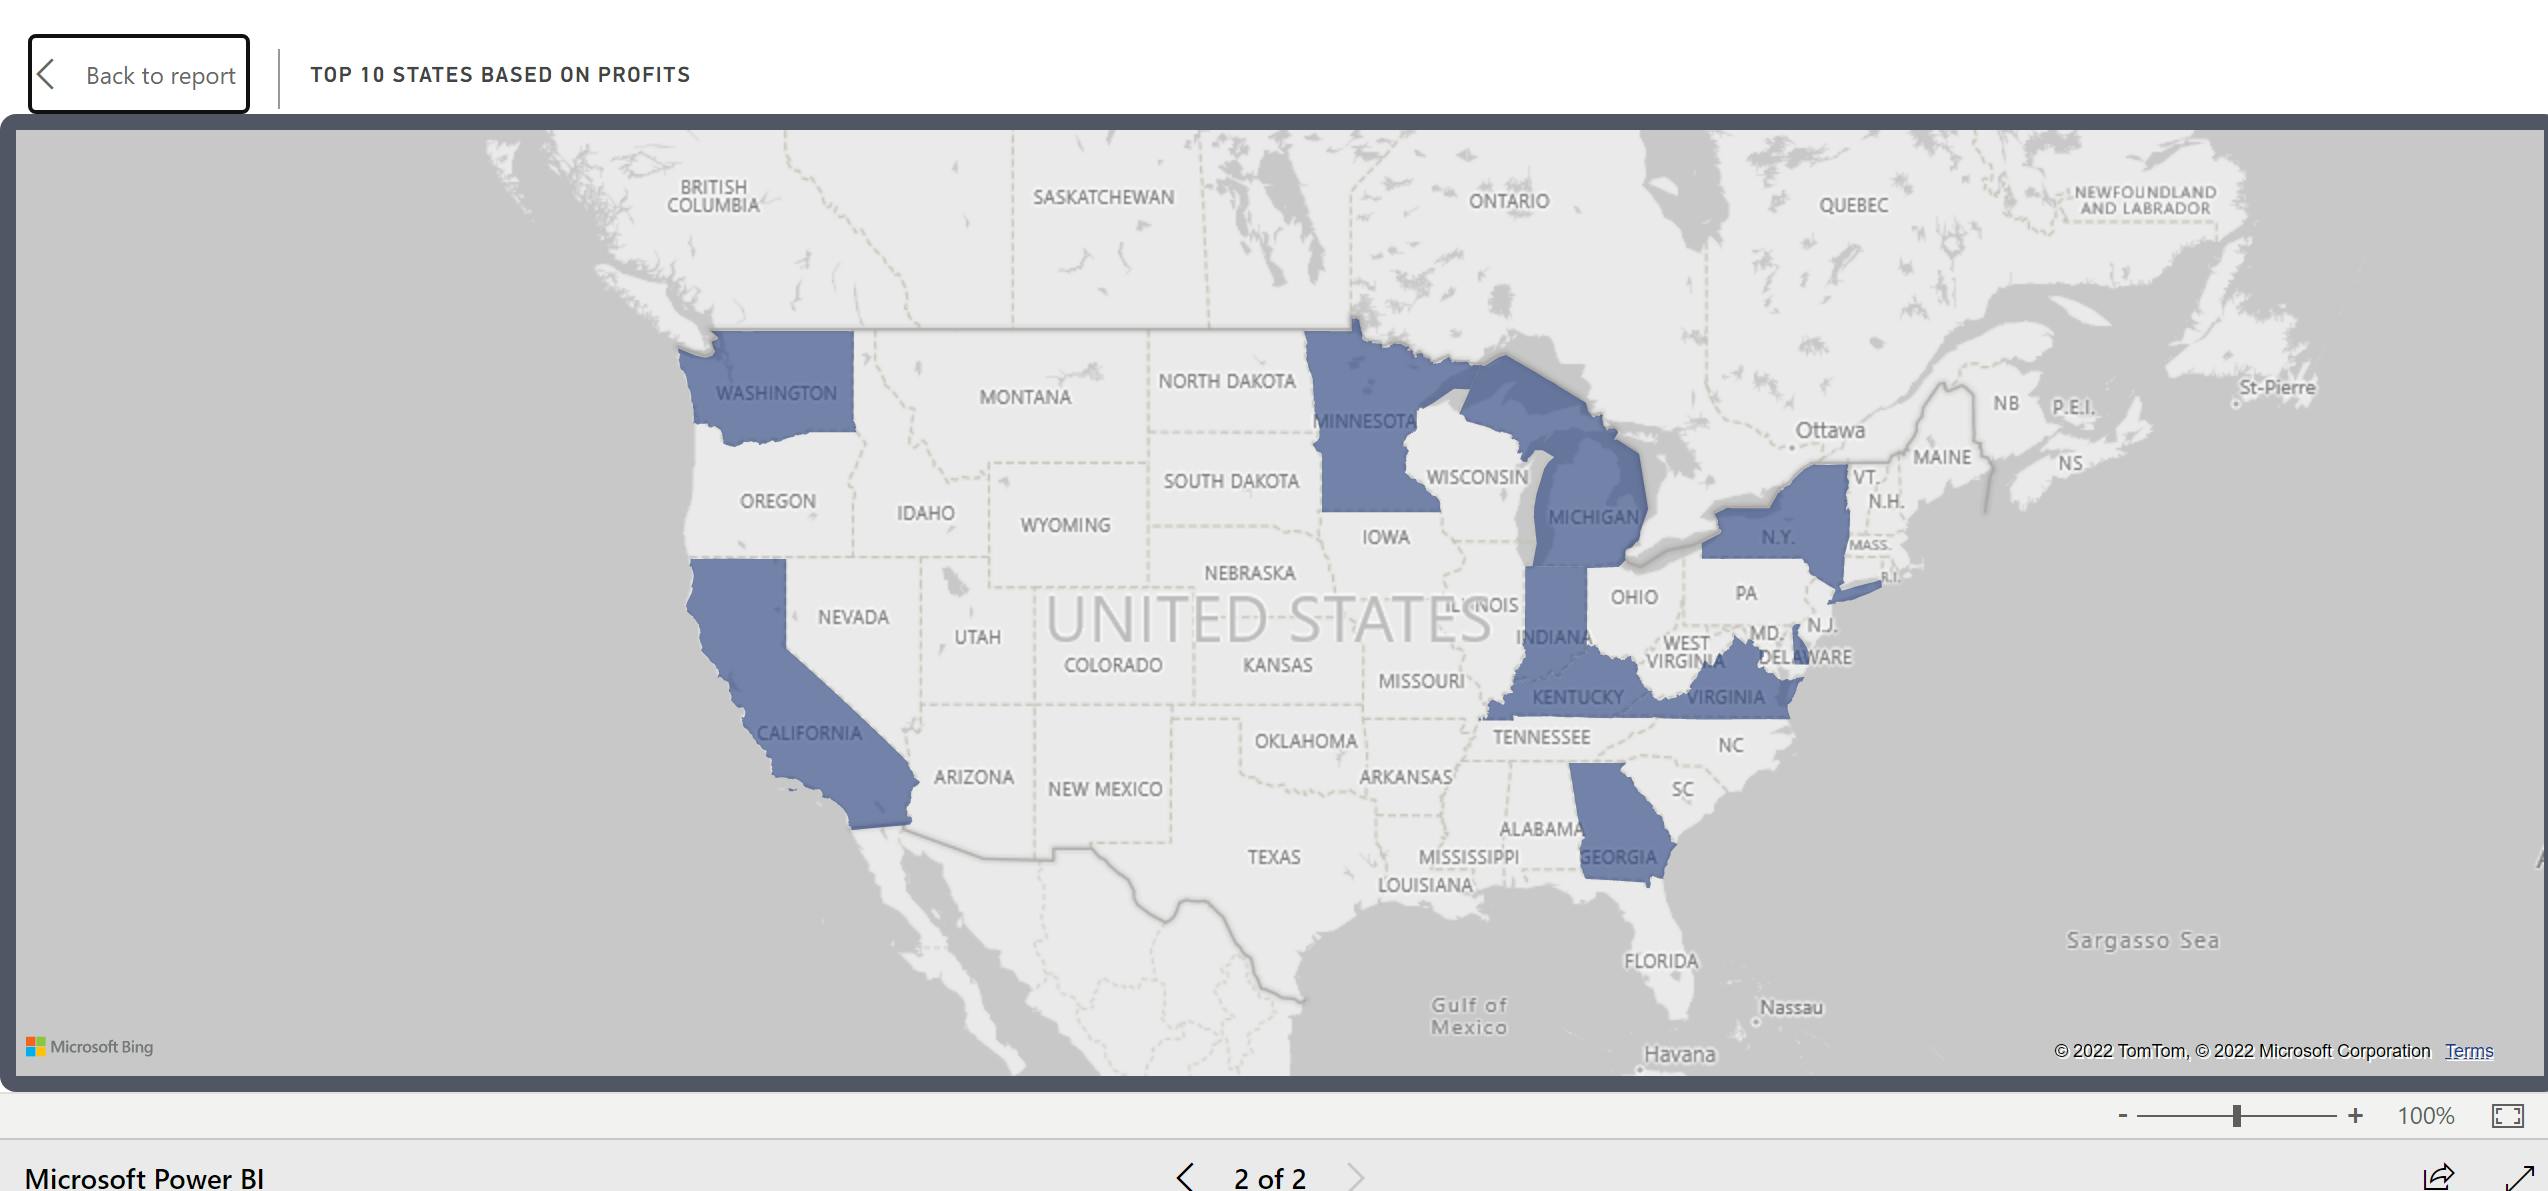
Map and Filled Map: For showing profits data based on city and sales.
Why did I choose Power BI and the learnings I got?
I choose Power BI as Power BI is very easy to learn, provides 60 days free trial in Power BI service and the Power BI desktop is always free to use. It provides options to connect with various data sources, has custom visuals, options to write python scripts, data transformation, table appending and merging, etc and provides data storytelling using dashboards and reports.
Following are the screenshots of the developed sales dashboard.
I got the below learnings while working on the project:
Importing data
Data transformations, DAX and table relationships
Power BI visuals and custom visuals
Filter pane and Power BI report page formatting
Publishing the report
Conclusion
See the published report, by visiting Superstore Sales Dashboard
Thanks for reading.🔥 Hope you like this report and article.🤩